Connecting Grafana to ClickHouse
With Grafana you can create, explore and share all of your data through dashboards. Grafana requires a plugin to connect to ClickHouse, which is easily installed within their UI.
1. Gather your connection details
To connect to ClickHouse with native TCP you need this information:
The HOST and PORT: typically, the port is 9440 when using TLS, or 9000 when not using TLS.
The DATABASE NAME: out of the box there is a database named
default, use the name of the database that you want to connect to.The USERNAME and PASSWORD: out of the box the username is
default. Use the username appropriate for your use case.
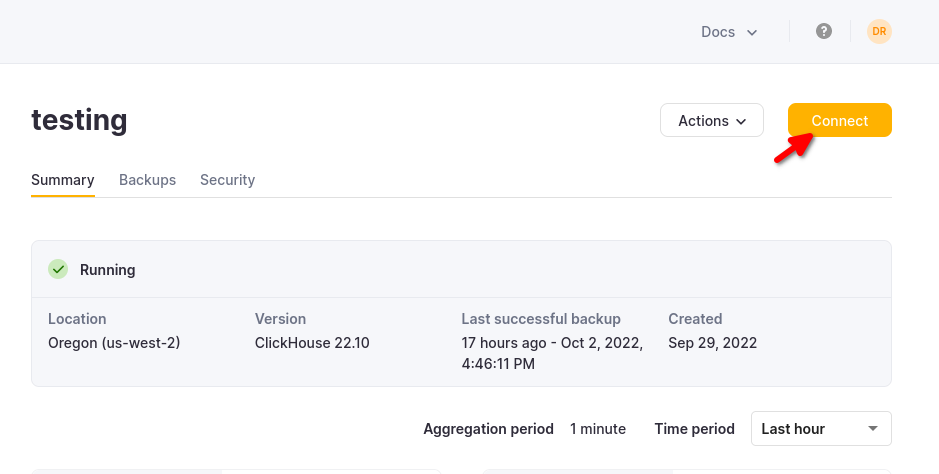
The details for your ClickHouse Cloud service are available in the ClickHouse Cloud console. Select the service that you will connect to and click Connect:
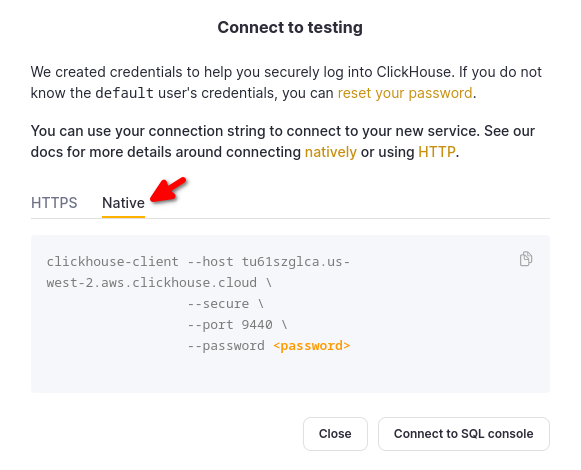
Choose Native, and the details are available in an example clickhouse-client command.
If you are using self-managed ClickHouse, the connection details are set by your ClickHouse administrator.
2. Install the Grafana Plugin for ClickHouse
Before Grafana can talk to ClickHouse, you need to install the appropriate Grafana plugin. Assuming you are logged in to Grafana, follow these steps:
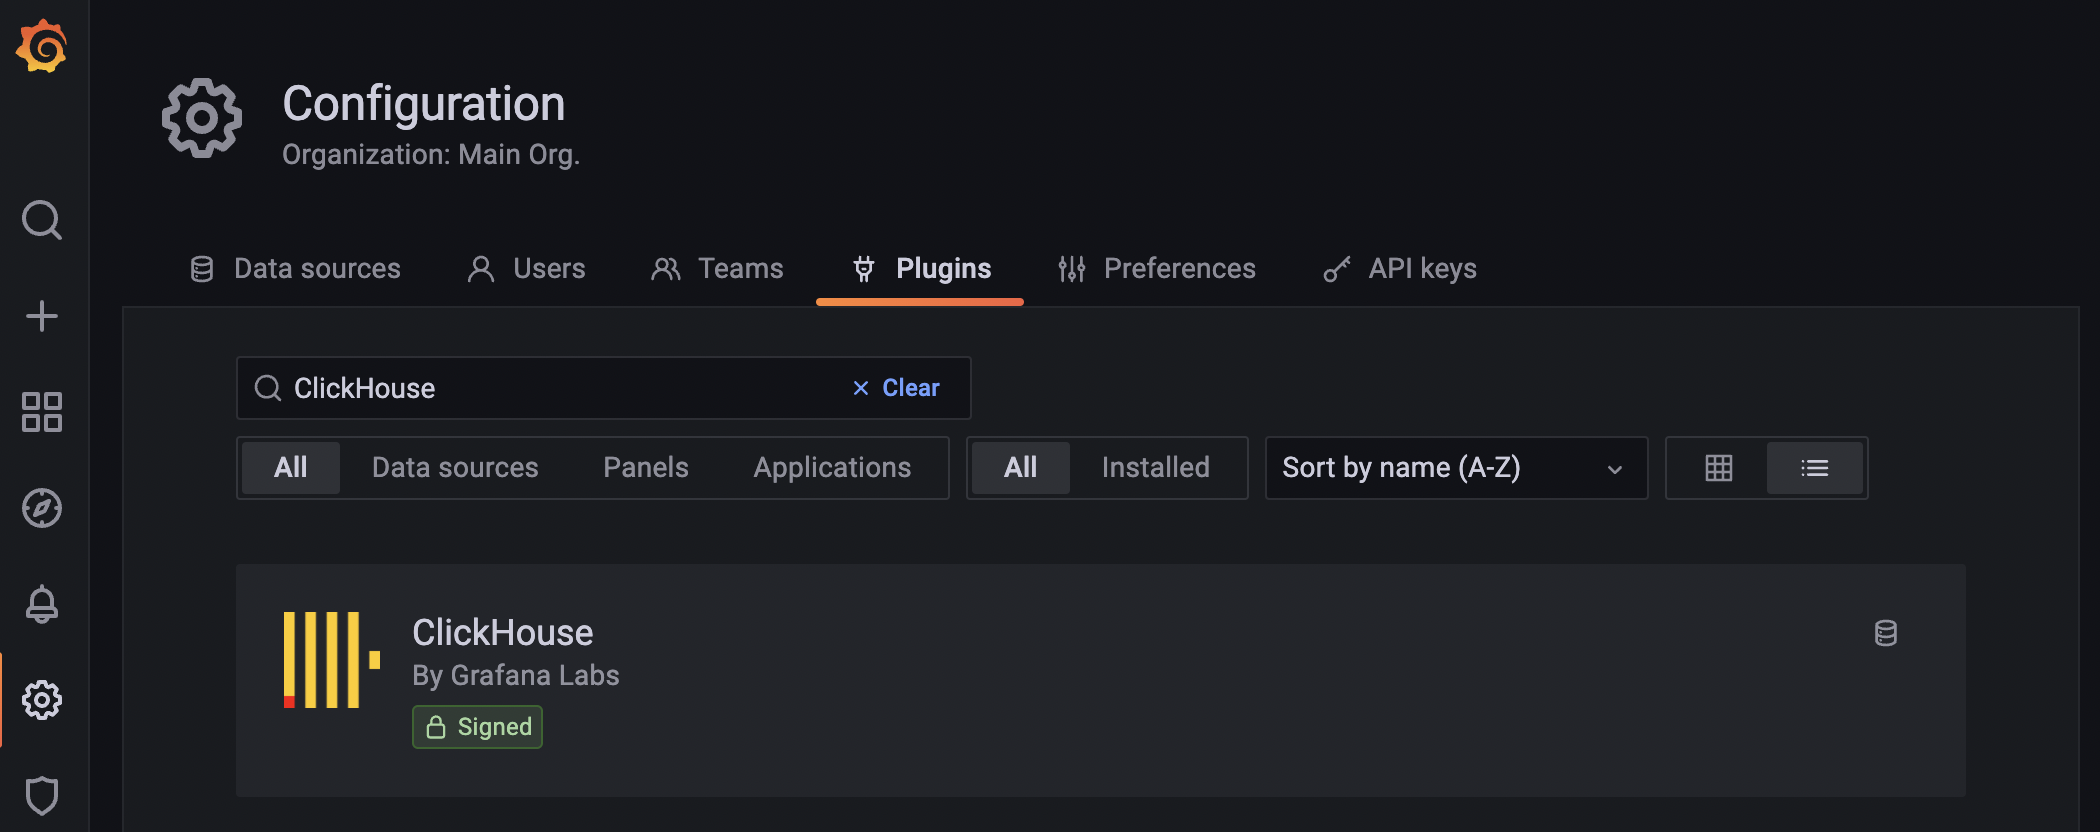
From the Configuration page, select the Plugins tab.
Search for ClickHouse and click on the Signed plugin by Grafana Labs:
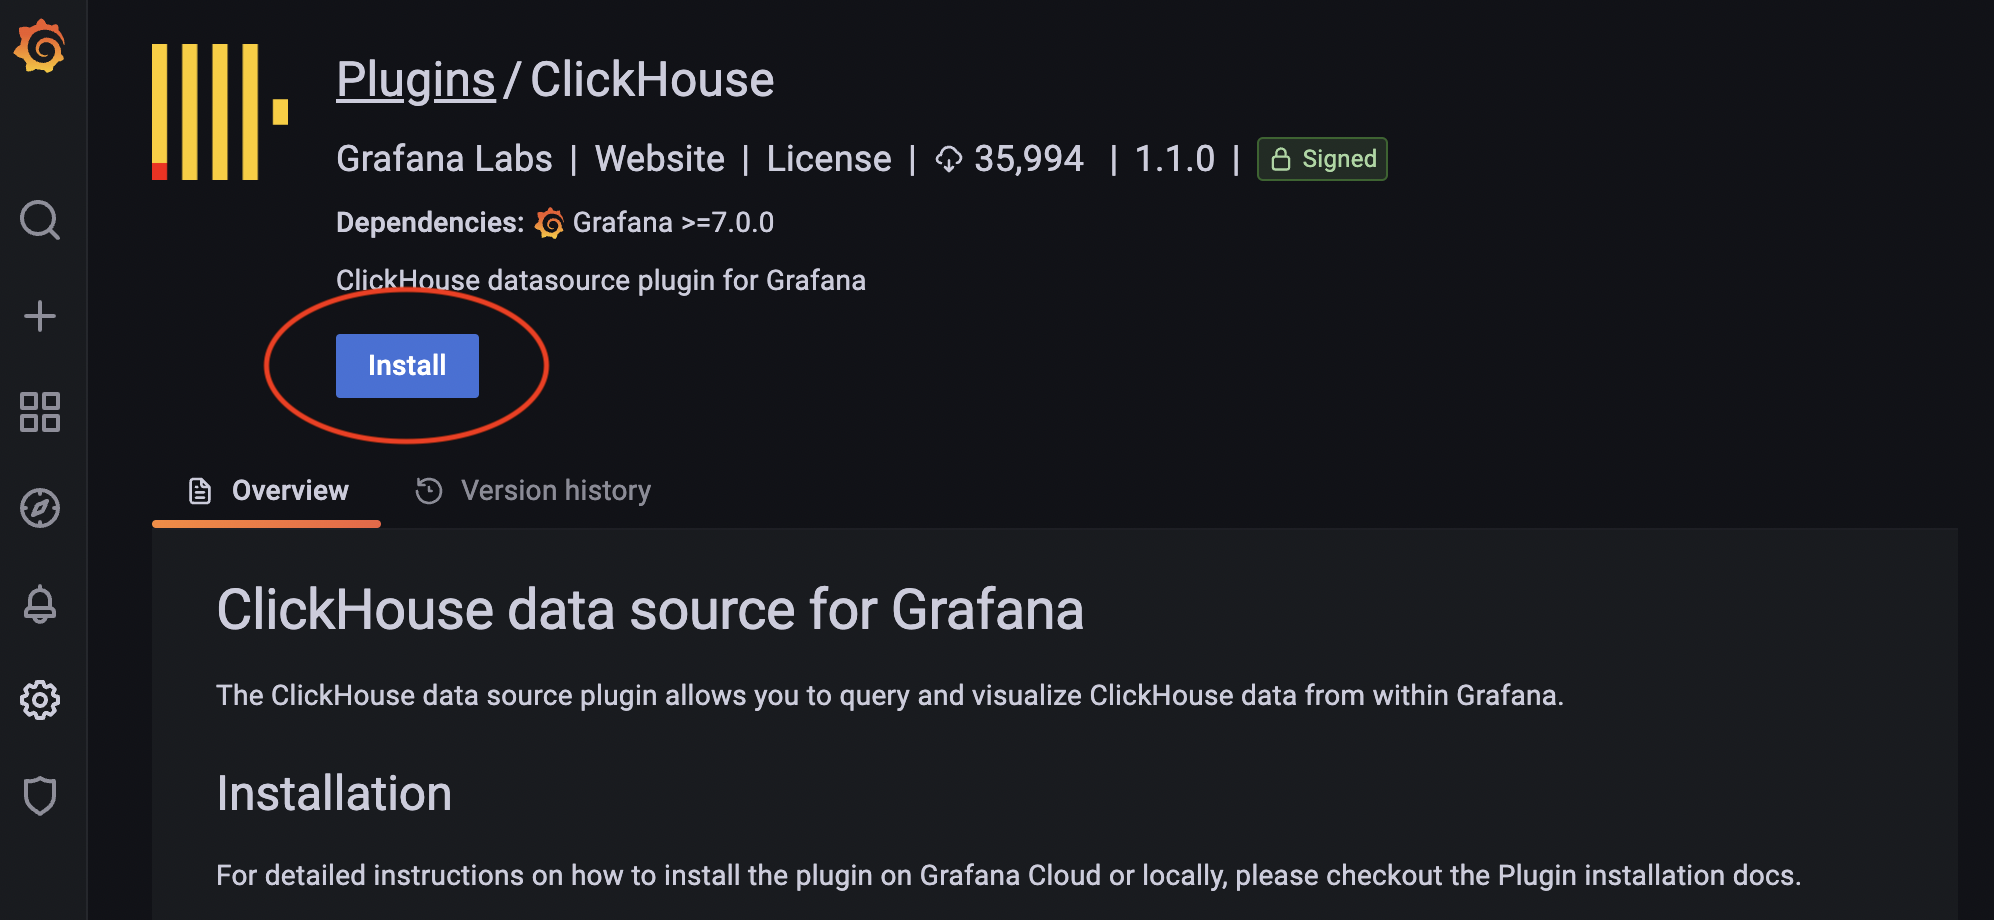
On the next screen, click the Install button:
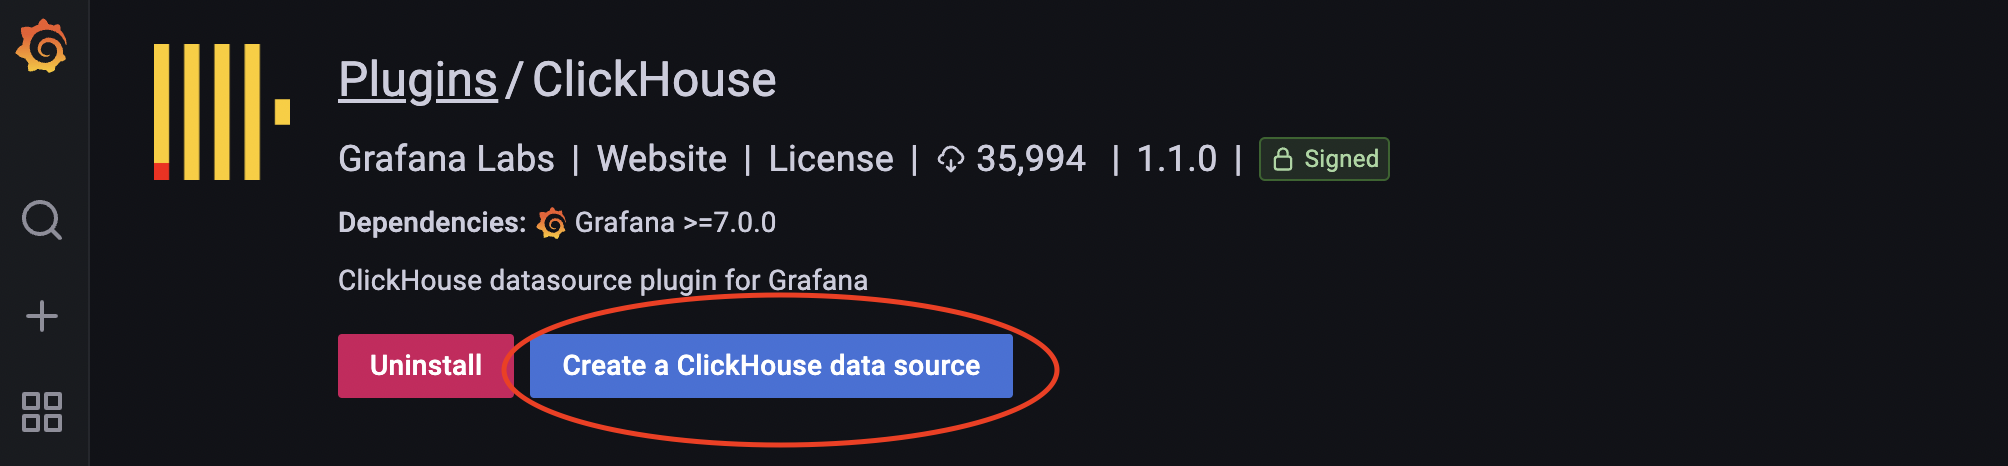
3. Define a ClickHouse data source
Once the installation is complete, click the Create a ClickHouse data source button. (You can also add a data source from the Data sources tab on the Configuration page.)
Either scroll down and find the ClickHouse data source type, or you can search for it in the search bar of the Add data source page. Either way, select the ClickHouse data source type and the following dialog appears:
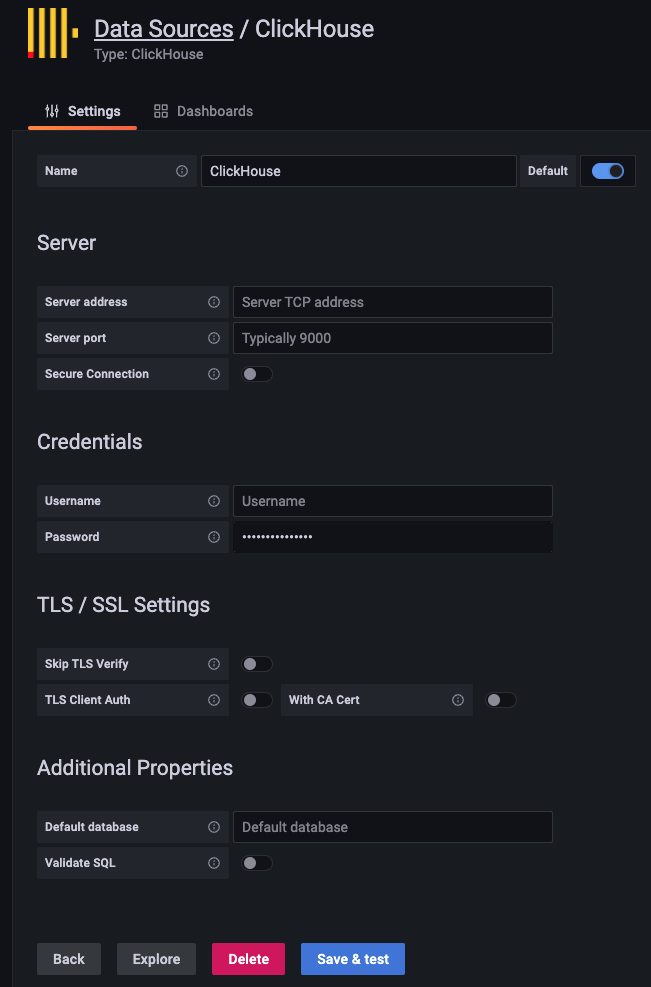
Enter your server settings and credentials. The key settings are:
- Name: a Grafana setting - give your data source any name you like
- Server address: the hostname of your ClickHouse service
- Server port: 9440 for secure, 9000 for unsecure (unless you modified the ClickHouse ports)
- Username and Password: enter your ClickHouse user credentials. If you have not configured users, then try default for the username.
- Default database: a Grafana setting - you can specify a database that Grafana defaults to when using this data source (this property can be left blank)
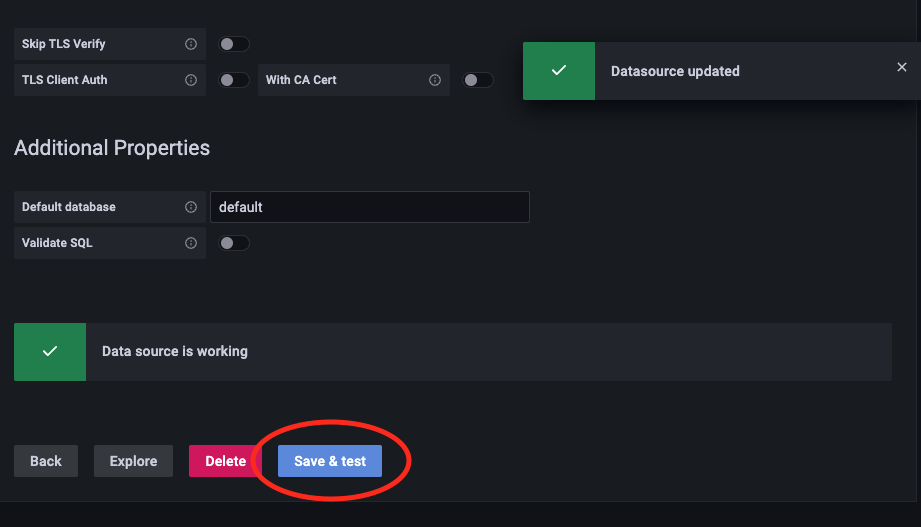
Click the Save & test button to verify that Grafana can connect to your ClickHouse service. If successful, you will see a Data source is working message:
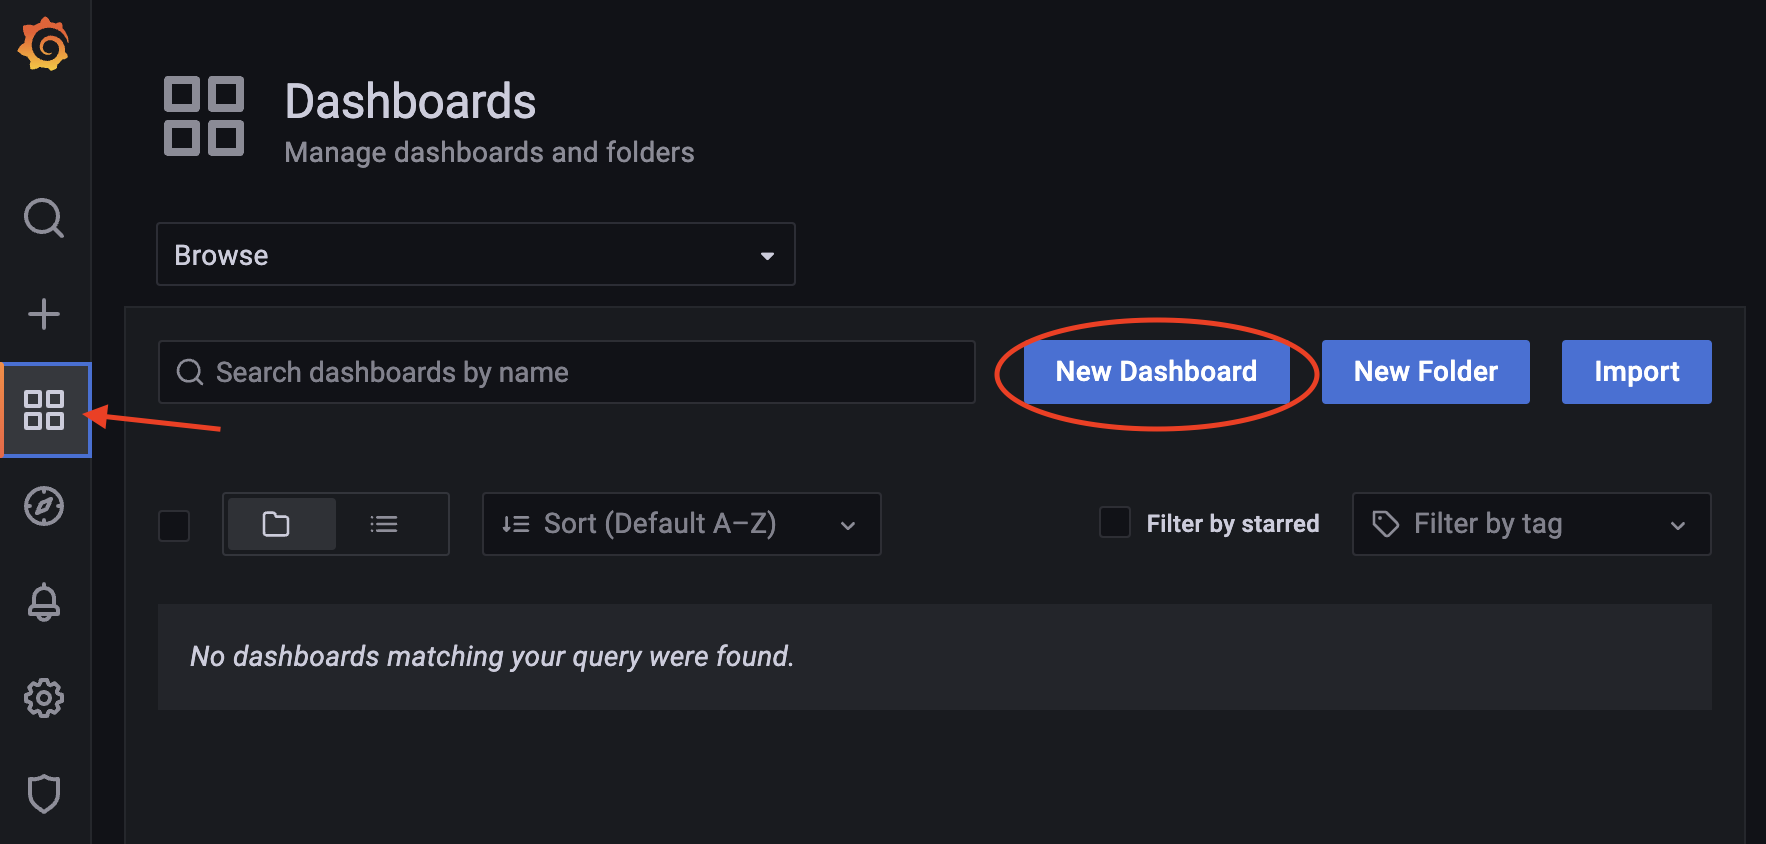
4. Build a dashboard
From the left menu, click on the Dashboards icon and select Browse. Then select the New Dashboard button:
Click the Add a new panel button.
From here, you can build a visualization based on a query. From the Data source dropdown, select your ClickHouse data source that you defined earlier. Then you can either use the Query Builder to build a query visually, or switch to the SQL Editor and enter a SQL query (as shown here):
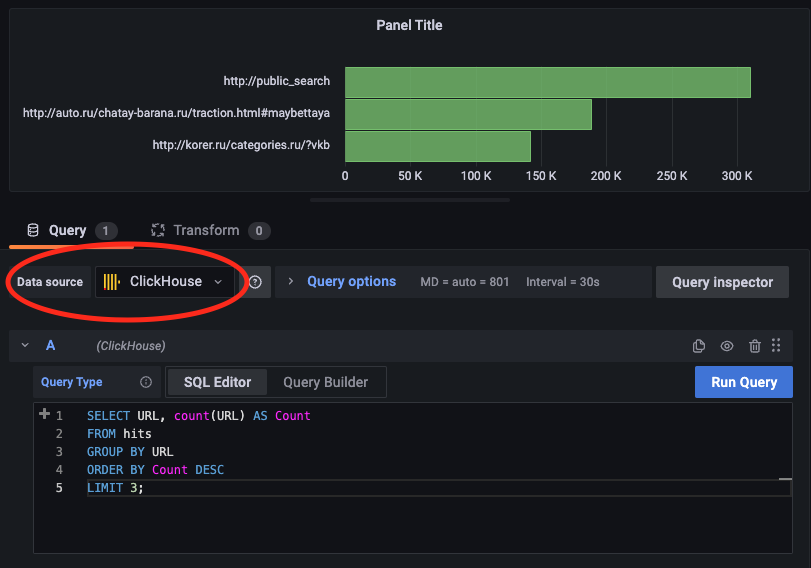
That's it! You are now ready to build visualizations and dashboards in Grafana.
Related Content
- Blog: Visualizing Data with ClickHouse - Part 1 - Grafana
- Blog: Visualizing ClickHouse Data with Grafana - Video
- Blog: ClickHouse Plugin for Grafana - 2.0 Release
- Blog: Getting Data Into ClickHouse - Part 3 - Using S3
- Blog: Building an Observability Solution with ClickHouse - Part 1 - Logs
- Blog: Building an Observability Solution with ClickHouse - Part 2 - Traces
- Blog & Webinar: A Story of Open-source GitHub Activity using ClickHouse + Grafana